Review Workflow
The core value of visual testing is the review process. retestr.ai provides powerful tools to triage differences efficiently.
Visual Diff View
When a test fails, you are presented with the Diff View.
- Baseline: The approved "Golden Master" image.
- Actual: The screenshot from the current run.
- Diff: A generated image highlighting the differences in red.
"Quick-Look" Baseline Hover
When viewing the main list of test cases, simply hover your mouse over the name of a test (which has a dashed underline) to instantly see its current approved baseline image in a floating popover. This is an excellent tool for rapidly scanning your suite to remember what each test covers, without needing to click into the test details or review runs.
Action buttons, including a Recording button to watch the video of the latest successful baseline execution directly from the list view, are available on each test case row. These buttons appear when you hover over the row on desktop and are fully visible by default on mobile devices to ensure accessibility.
Smart Artifact Grouping
Instead of a flat list of files, retestr.ai intelligently groups related artifacts.
- Visuals: Baseline, Actual, and Diff images are grouped together for easy comparison.
- Videos: View the video recording of the test execution to visually confirm the test's behavior. Available in the Run Details view under the "Videos" section, or directly from the Test List via the test action buttons.
- Logs: Console logs and network activity are tabulated.
- Data: JSON reports (accessibility, metrics, 3D scene graphs) are rendered in a structured viewer.
- Trace: The Playwright trace file is available for download or deep inspection.
Quick-Filter by Failure Reason
When triaging a massive run with dozens of failures, it helps to group them logically. You can use the faceted search UI in the test list to instantly filter failures by their AI-triaged reason:
- Show me only "Layout Shifts".
- Show me only "Text Changes".
- Show me only "Network Errors".
This allows you to batch-approve intended text changes while investigating true bugs.
Inspection Tools
- Swipe / Onion Skin: Overlay the Actual image on top of the Baseline and swipe back and forth to spot subtle shifts.
- Flip Comparison Mode: Rapidly toggle back and forth between the Baseline and Actual images like a flipbook by pressing the
Spacebar. Because the human eye is highly sensitive to motion, this is often the most effective way to spot subtle structural or layout shifts. - On-Screen Measurement Tools: Need to know exactly how many pixels a button shifted? Use the on-screen caliper tool to draw lines directly on the diff canvas and measure pixel distances and bounding boxes.
- Magnifier (Loupe): Hover over the image to zoom in on pixel-level details.
- Heatmap: Toggle a heatmap overlay to see where the most significant visual changes occurred, helping you focus on the "hot spots" of a regression.
- Client-Side Diffing: Experience instant feedback with pixel comparisons computed directly in your browser using the Canvas API, avoiding server delays for quick checks.
AI Insights
retestr.ai leverages AI to help you understand failures instantly without digging into code.
- Smart Triage (Visual): Automatically categorizes visual diffs (e.g., "Layout Shift", "Text Change", "Rendering Noise") and provides a one-sentence summary of what changed.
- Failure Summaries (Script): For script errors (timeouts, missing selectors), the AI analyzes the error logs and console output to explain the root cause in plain English (e.g., "The Login button was not found because the page took too long to load").
Debugging Context
retestr.ai provides rich context to help you diagnose why a test failed. To reduce visual noise for non-technical users, some of these technical details are collapsed by default.
Note: If you are an advanced user, you can permanently expand these technical details by enabling Developer Mode in your user settings.
- Console Log Mirroring: View browser console logs (log, warn, error) side-by-side with the visual diff (nested under "Technical Logs & Data").
- Repro Scripts: Click "Copy Repro Script" to get a standalone Playwright script that reproduces the exact failure state locally.
- Environment Metadata: See the exact browser version, OS, and viewport dimensions used for the snapshot.
- JSON Pretty Viewer: JSON files generated during the test (e.g., accessibility reports, custom metrics) are rendered in an interactive, collapsible tree view for easy inspection (nested under "Technical Logs & Data").
- Error Stack Traces: For script errors, the raw stack trace is collapsed by default, leaving the plain-English AI Failure Summary visible.
- Live Debugger: A VNC Keep-Alive debug session is available but collapsed by default to prevent a large, intimidating black box from dominating the page.
- Custom Metrics Card: Any custom metrics you log during your test script (such as load time, memory usage, or custom KPIs) are displayed clearly in a dedicated card for quick review alongside your test results.
- Quick Rerun: Instantly rerun a single failing test case directly from the results card to verify a fix.
Approval Workflow
- Review: Examine the diff.
- Approve: If the change is intentional (e.g., a design update), click Approve (or press
A). This promotes the "Actual" image to be the new "Baseline". - Reject: If the change is a bug, mark it as Failed (or leave it as is) and file a bug report.
Sticky Actions Header
To make it easier to manage large test runs, the Run Status and action buttons (Approve All, Cancel) stick to the top of the screen as you scroll through the list of diffs. This allows you to perform actions at any time without scrolling back up.
Baseline History & Revert
Every time you approve a new baseline, the old one is archived. You can view the Baseline History to see how a test case has evolved over time.
- View History: Click the "History" icon on a test case to see a timeline of approved baselines.
- Revert: Made a mistake? You can select a previous baseline and click Revert to restore it as the current active baseline.
Visual Masking
Sometimes, parts of the page are dynamic (e.g., timestamps, ads, carousels) and cause false positives.
- Visual Masking Editor: Draw rectangles directly on the baseline image to ignore those regions during comparison.
- Global & Shared Diff Masks: Define "Global Masks" (e.g., "Chat Widget", "Cookie Banner") that are automatically applied to all tests or specific suites. You can configure these in the Settings > Global Masks section.
Auto-Collapse Passed Tests
When viewing large test suites, retestr.ai defaults to collapsing all passed tests, leaving only failed tests expanded. This reduces visual noise and helps you focus immediately on failures.
- You can override this behavior globally via your user settings or manually toggle individual tests in the Run Details view.
Relative vs Absolute Time
By default, timestamps are displayed in relative time ("5m ago"). If your workflow requires absolute precision ("10:00 AM"), you can toggle off "Relative Time" globally in your Settings.
Keyboard Shortcuts
Speed up your review workflow by using keyboard shortcuts:
| Key | Action |
|---|---|
J | Move selection down to the next test result. |
K | Move selection up to the previous test result. |
/ | Auto-Focus Search Bar: Instantly focus the main search/command palette from anywhere in the Dashboard. |
F | Jump to First Failure: Instantly scroll and expand the first failing test in a long result list, saving you from hunting through hundreds of passed tests. |
Enter | Focus/Open the selected test result. |
[ | Jump to Previous Failure: Instantly scroll to the previous failing test. |
] | Jump to Next Failure: Instantly scroll to the next failing test. |
Right Arrow | Switch to the next tab within a result card (e.g., Diff → Actual). |
Left Arrow | Switch to the previous tab within a result card (e.g., Actual → Diff). |
A | Approve the current diff (when viewing "Actual" tab). |
Spacebar | Flip Comparison Mode: Toggle back and forth between Baseline and Actual images. |
Cmd+K | Open the Command Palette to jump to tests or settings. |
? | Toggle Shortcuts: Open the global keyboard shortcuts cheat sheet modal. |
Sharing Results
You can share the results of a test run with your team by simply copying the URL from your browser. retestr.ai automatically generates a Dynamic Open Graph Image for every run.
When you paste the link into Slack, Microsoft Teams, Discord, or Twitter, a rich preview card (Open Graph image) will appear showing:
- Run Status (Passed/Failed)
- Project Name & Branch
- Pass/Fail Counts
This allows your team to see the status of a build immediately without clicking through to the dashboard.
Compliance & Auditing
For regulated environments, you can enforce stricter approval workflows.
Require Approval Reasons
Admins can enable "Require Approval Reason" in Project Settings. When enabled, users must provide a text reason (e.g., "Design Update per TICKET-123") whenever they:
- Approve a Visual Diff (promote baseline).
- Accept a Test Variation.
This reason is logged in the Audit Trail for compliance purposes.
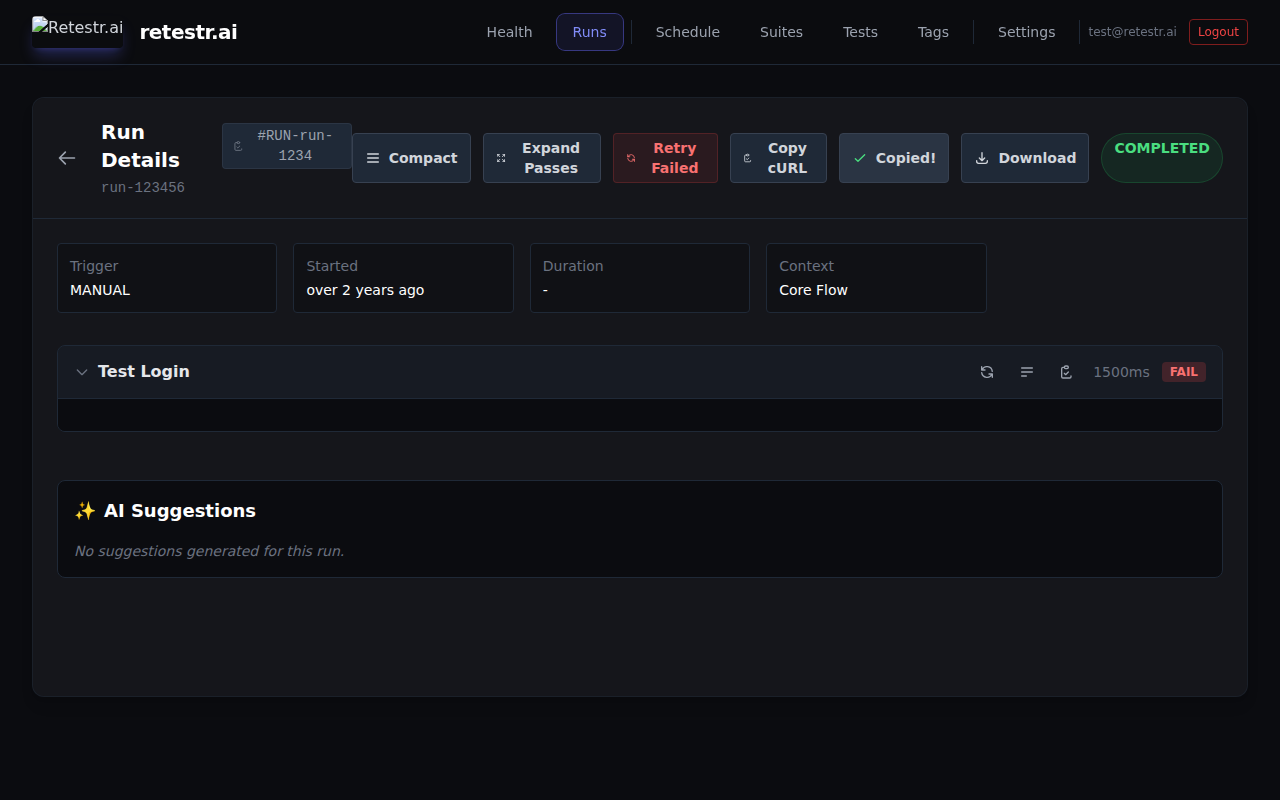
Quick Actions in Run Details
To keep the interface clean, secondary actions are neatly organized while primary actions remain immediately accessible:
- Action Buttons: Use the inline action buttons on any test result to access advanced options like Copy as Markdown, Copy Repro Script, and Create Issue. This keeps the main result header focused on the primary Rerun action.
- Trace Viewer & Downloads: Click the Download button in the run header to download all artifacts, or click the Open Viewer button next to trace artifacts in the details view. This reduces visual clutter while keeping powerful debugging tools accessible.
- Copy Trigger as cURL: Click the "Copy cURL" button in the run header to copy a pre-formatted
curlcommand to trigger the exact same run via API. - Copy Branch Name: Click the branch name in the run header to instantly copy it to your clipboard.
- Copy Run ID: Click the
#RUN-ID badge in the run header to copy the full UUID of the current run for API usage or sharing with support.